Introducing a New Type of Civic Tech
Tools for good government in the age of AI
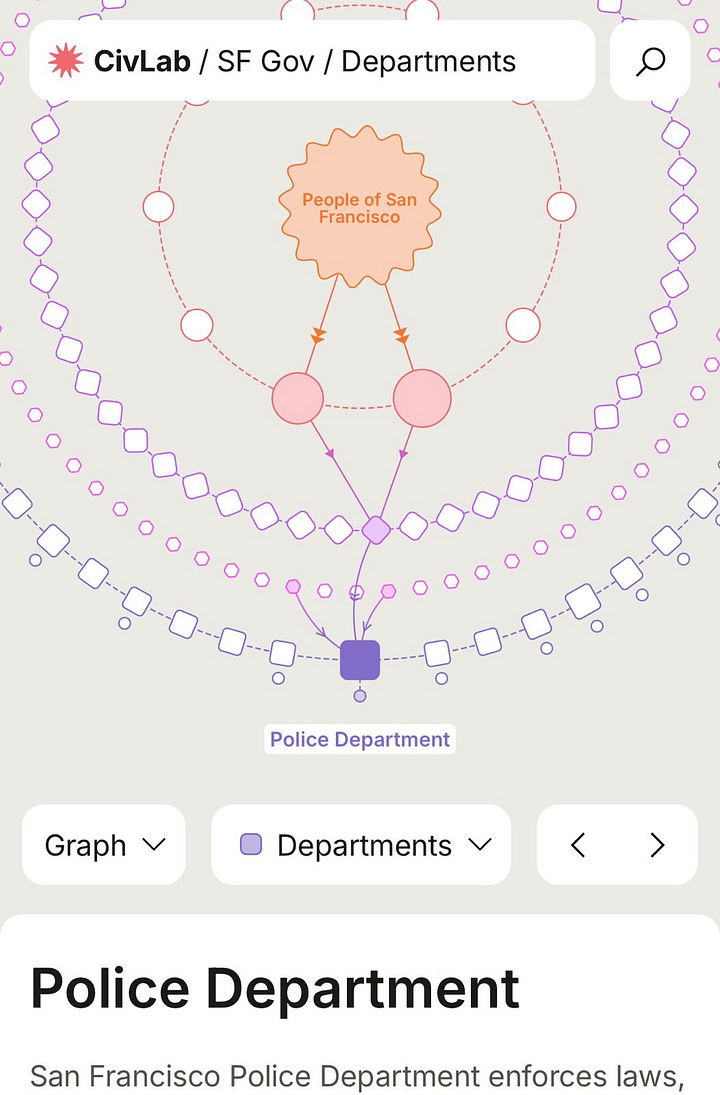
Every citizen should have a live, systems view of their government and today we’re bringing that to SF! You can track government entities, spending, news, public meetings, and more in real time.
Check it out here!
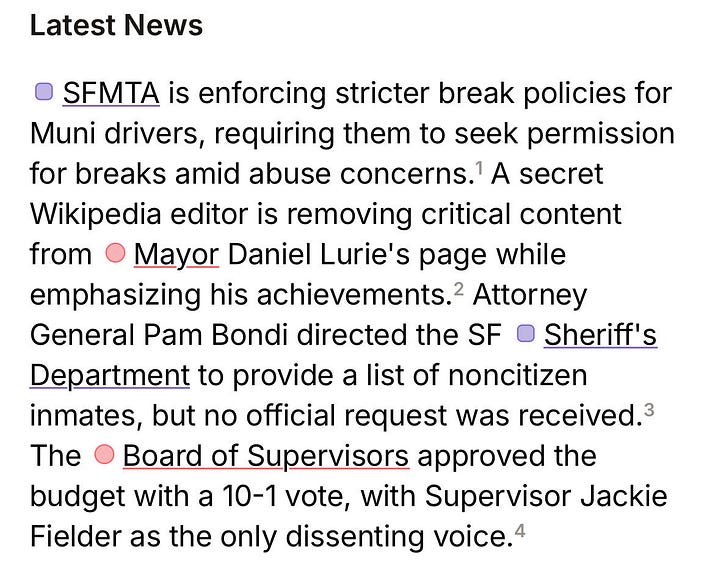
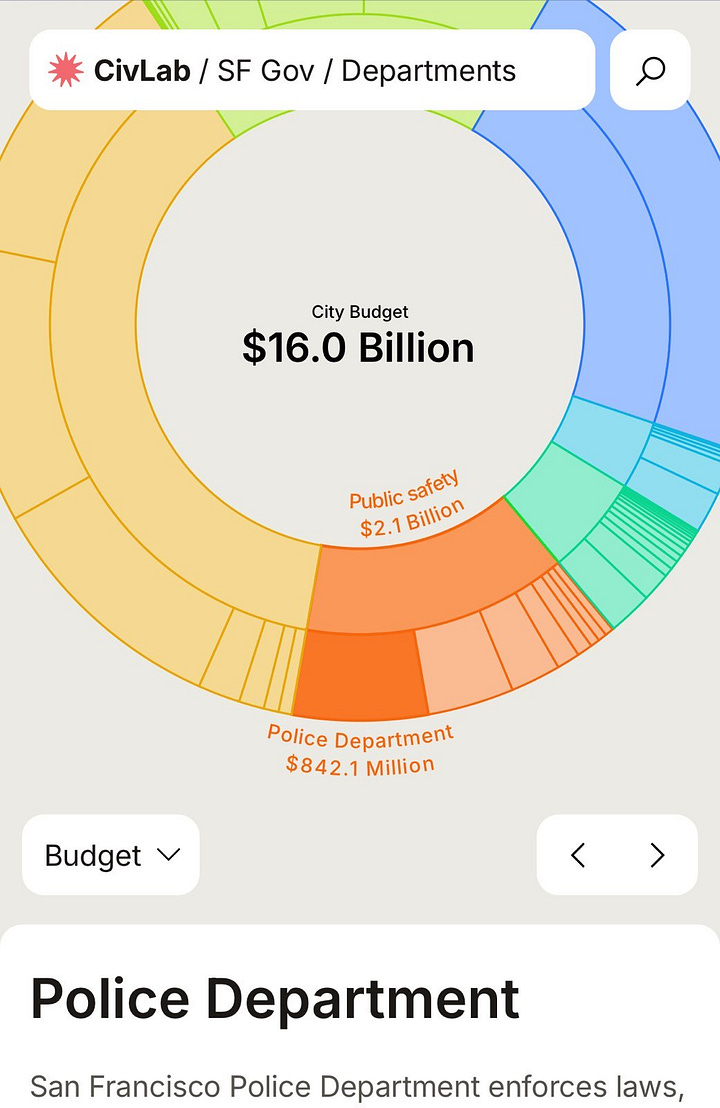
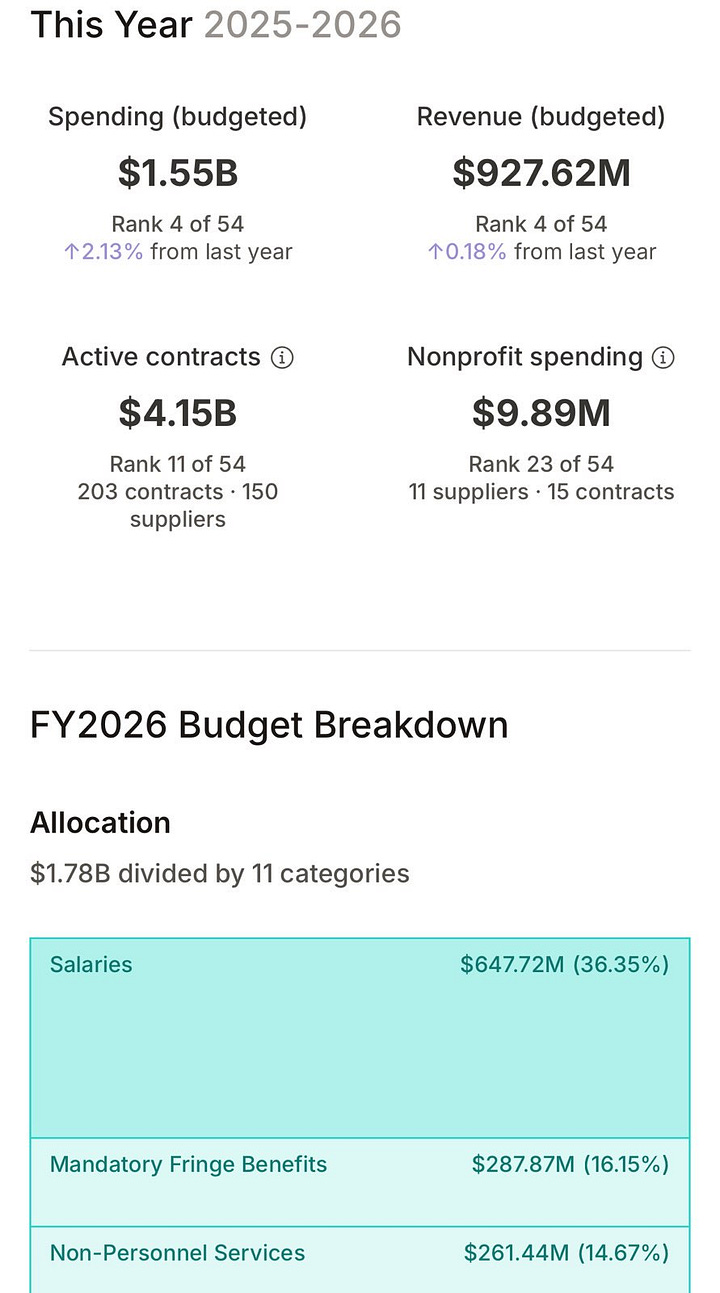
I particularly like the latest news summaries, interactive budget donut, and departmental spending breakdowns. This data also includes contracts to non-governmental organizations like nonprofits, which was a highly-requested feature.
We also completely rebuilt the ring rotation mechanism to deliver a sharp mobile experience. I hope you like it!


Using LLMs, our small team was able to aggregate and process an enormous amount of data. We fully intend to bring this platform to every city government. If you want the gov graph where you live, comment below on what you want to see.
One year ago today I launched v1 of the gov graph. That is also how I met Kifah. He cold DM’ed me on Twitter after seeing the launch post and has been working with me ever since. If you like what we’re building and want to help usher in good government in the age of AI, reach out to me here or here. The future is what you make it.


Hi Michael, I really like your work! I am currently finishing my MPA degree and my project is using AI for efficiency with transparency in government. I woould love to collaborate.
Such a great application of AI for civic improvement! I'd be curious to understand if something like this could better quantify how even well intentioned gov systems and process add red tape in both time and cost.